
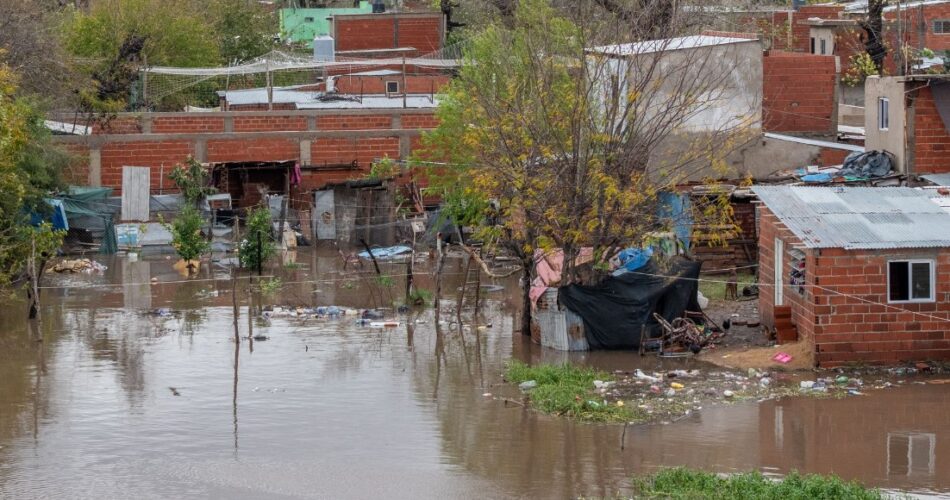
- In early May, heavy weather hit parts of the Western, Eastern and Northern Cape. at least 10 lives , Thousands of people were displaced and badly damaged Roads, buildings and utility systems.
- Climate scientists agree that intense rainfall and heavy storms will occur more frequently and become more unpredictable in the future.
- But can every extreme weather event be blamed on climate change?
- We look at how data from the past and models about the future can help decision makers plan for changing climate patterns.
- This is the second part of a three-part series in which our Bhekisisa Data team dives into thousands of data points to explore what climate change could mean for South Africa. read the first part Here .
Climate scientists agree that intense rainfall and heavy storms will occur more frequently and become more unpredictable in the future. But can every extreme weather event be blamed on climate change? We look at what past data and future predictions say.
the weather is good for small talk . But recently it has been continuously making big headlines.
In the first five months of this year alone, parts of South Africa have been hit by storms, floods and prolonged or scorching heat, government says Ongoing Three notice About weather-related national disasters and official warnings extreme heat Between January and May.
What should I follow WhatsApp | Linkedin for latest headlines
Researchers agree that global warming Burning fossil fuels causes the release of large amounts of greenhouse gases. Just as coal and oil can be clearly linked to intense rains and heavy storms happening more often .
But how badly unexpectedly heavy weather will affect people's lives depends on a combination of environmental factors and the preparedness of communities.
“We are vulnerable to events that we may be able to predict but that we may not be able to predict their actual intensity in specific locations,” President Cyril Ramaphosa said in a statement. statement Flooding immediately followed days of heavy weather in parts of the Western, Eastern and Northern Cape in early May. at least 10 lives , Thousands of people were displaced and badly damaged Roads, buildings and utility systems.
And it's exactly this kind of unpredictability that climate experts say the world needs to brace for as long-term weather patterns change.
But can every extreme weather event be blamed on climate change?
To answer this, scientists compare how likely an event of the same intensity would have been if the atmosphere had not warmed as much as it did about 150 years ago.
For example, what caused the rain? heavy flood This probably happens every 50 years in January in Limpopo, Mpumalanga and parts of Mozambique, researchers found Which makes it a rare occurrence. But this would have been even rarer had the air not been about 1.3°C warmer, their analyzes showed. Furthermore, the dataset they looked at revealed that rainfall is becoming about 40% more intense during such periods.
Having historical or baseline data to compare to current events is important to help scientists predict how things may change, which, in turn, can help decision makers plan ahead to better handle the consequences of extreme weather.
In today's story – the second in our series about what climate change could mean for South Africa – we look at what the data says about the country's baseline and potential future weather patterns. Missed Part 1? read this Here .
One country, five climates
South Africa has five distinct climate zones Areas to the west are generally dry and hot while areas to the east experience mild temperatures and wet days.
Where people live depends largely on what weather patterns are like in an area. Places with fairly mild temperatures and adequate but not excessive rainfall are often desirable, as there is likely to be enough water and fertile soil to grow food.
For example, about two-thirds Our analysis showed that most of the South African population lives in climate zone 2 (covering Gauteng, Mpumalanga, KwaZulu-Natal, the Eastern Cape and the Free State and parts of the North West), with mild temperatures and year-round rainfall, while less than 1% of the population lives in climate zone 4 (covering the Northern Cape), which is characterized by hot, desert-like conditions. (In our analysis, we used census data for 2022 This is to determine how the districts fit into the projected climate zones, which is why the colored boundaries have squiggly lines. In real life, regions will not obey such precise boundaries.)
But governance structures – and this means how money is allocated to build and maintain roads, schools and clinics, and provide services like electricity, water and sanitation to people – do not obey climate boundaries.
Instead, the Constitution says The treasury must give to each province Appropriate amounts of money from the available kitty depending on the number of people in a province and their specific social or development needs. For the current fiscal year (2026/27), the provinces have roughly Available from R11000-R17000 per person – Made up of provincial allocations and a small amount of conditional grants – for the care of its constituents (does not include money that is given to national departments).
So, a province like the Northern Cape, which has a population of about 1.4 million people and is spread over an area of approximately 373 000 km2 which includes three different climates, will have less money available than KwaZulu-Natal, which has nine times more people but only about one spread quarter size of the Northern Cape and falls in the same climate zone.
looking ahead
Scientists who helped the government report The data, pieced together to measure how well countries are doing in meeting their UN climate pledges, show what changes in temperature, rainfall and dry periods can be expected in each climate zone for different levels of global warming. he used it So-called SSP3-7.0 scenario Joe considers “a rocky road” ahead due to things like slow economic growth, high inequality and barriers to international trade.
To make such forecasts, they use “a family of models, each of which is running a standard experiment, but with different assumptions, and also input data from a larger area, including the surrounding oceans”, explains Mohau Mateyisi, a climate scientist at the Council for Scientific and Industrial Research and part of the reporting team. This, he says, means that the modeling gives a variety of answers, which are slightly different.
However, estimates from models are estimates, and so there is always some uncertainty associated with the answers, Matteisi explains. If all models return values with the same direction of change (e.g. all positive or all negative), researchers interpret this as showing a reasonable amount of certainty in the expected values. This is often the case with temperature estimates.
But if some models give positive values as answers and others give negative values, this suggests that the estimate is less certain. This is often the case with projections of future rainfall.
In the plot shown here, the colored part of the “box” shows the spread of final values returned by the different models used in the calculations. A longer area means there is more variation between values from which the mean – shown by the black horizontal line inside the box – is calculated. The “whiskers” show the minimum and maximum values in the range, and if they are longer, it means there is even more variability around the median.
Below paris agreement Countries are committed to trying to keep the Earth's atmosphere from warming more than 2 degrees Celsius compared to about 150 years ago. Modeling results show that if we fail to achieve this and global temperatures reach this upper limit of warming, daytime temperatures across South Africa could be about 2–3 °C higher than between 1961 and 1990 (top panel). Researchers say this suggests that some areas of South Africa may be warming faster than the global average.
The largest increase in temperatures is expected to occur in climate zone 1, a hot, summer-rainfall region in the northern part of South Africa. In climate zone 2, which covers the eastern interior of the country, an average increase of about 2°C can be expected, although increases between 1°C and about 4.5°C are possible. The lowest temperature rise is expected to be less than – 2 °C in climate zone 5, which covers almost the entire Western Cape.
Average precipitation is expected to change by less than 10% compared to the previous (middle panel), although regions 3 and 4 – that is, the central interior and the hot, desert-like region to the west – may see considerable variability in precipitation. But even more: Because the range of values modeled for those regions includes both positive and negative values, there is also considerable uncertainty about the projections, which tells the researchers that rainfall will likely be unpredictable.
When we look at the duration of the dry period, the picture becomes clearer. Dry periods are likely to be prolonged across the country, and particularly in climate zones 1 and 4, which are the hottest and driest parts of South Africa. These results appear to come with considerable variability and with almost no change in total rainfall, it is possible that heavy, sudden and unexpected rainfall may occur over much of the region.
Sign up for free AllAfrica newsletters
Get the latest African news straight to your inbox
looking back
South Africa has been hit by 82 devastating floods and storms such as high winds or severe hail or snow between 1980 and 2023, and Analysis shows – And trends show the count will increase. In the first four years of the current decade, there have been as many floods as in the entire 10 years between 2000 and 2009.
These extreme weather events appeared to be converging over the eastern parts of the country, researchers found KwaZulu-Natal has been particularly hard hit. While it is not unexpected that eastern parts of the country will see more rainfall than the drier west, simply due to natural climate patterns in South Africa, the authors write that attention should be paid to the consequences of such extreme events.
Their analysis shows that flooding was most commonly reported in large urban areas, regardless of where in the country it occurred, which suggests that “Human factors may play a role in increasing the impact of intense rainfall events in metropolitan areas” .
A fast study Heavy rains and the resulting floods in southern Botswana and KwaZulu-Natal in February 2025 showed something similar: when urban areas grow rapidly but infrastructure and services do not keep pace, intense rain can easily overwhelm things like drainage systems and make the impact even worse.
harm from human-induced climate change Not only the threat of the future, but also the present reality experts say. To prepare itself against storms, the world must not only adapt to what has already changed, but also act to prevent Earth's air from warming further.
Mateyisi says: “Although models cannot give us precise answers, they will continue to improve and we must use them as the best available science. The choices we make now must put people's lives first; we cannot afford not to act.”
Keep an eye out for the third and final part of this Bhekisisa Data Story series on 15 June on what climate change could mean for the future of South Africa.
This story was created Bhekisisa Center for Health Journalism. sign up for Newsletter.